
1. The Molecule Paradox: A Segmented Landscape
When an industrial manufacturing unit in India purchases standard commercial fuels like LPG, furnace oil, or diesel, they typically pay a uniform monthly price declared by oil marketing company price lists. Natural gas is the solitary, glaring exception.
In India's natural gas ecosystem, two companies situated in the very same industrial cluster, connected to the exact same transmission pipeline, receiving the exact same CH₄ methane molecule from the same supplier can pay radically divergent prices:
- A City Gas Distribution (CGD) entity might pay $6.50 to $7.00/MMBtu for domestic APM gas allocated under sovereign priority guidelines.
- A ceramic tile manufacturing unit next door relying on monthly spot regasified LNG (RLNG) might pay $18.00 to $22.00/MMBtu for the exact same thermal energy.
- A fertilizer plant or large refinery receiving gas under a decade-old crude-linked term contract might land molecules at $12.20/MMBtu.
To make sense of this intricate marketplace, India's pricing mechanisms can be organized into three distinct pillars encompassing seven individual pricing regimes.
2. The 3-Pillar Pricing Architecture
Every molecule consumed across Indian industry originates from one of three broad categories: Domestic Regulated Production, Imported Regasified LNG (RLNG), or the emerging Exchange-Traded Market.
- Domestic Gas (Field Output): Administered Price Mechanism (APM) gas for nominated fields, New Well gas (+20% premium), and High-Pressure High-Temperature (HPHT) deepwater gas subject to bi-annual price ceilings.
- Imported LNG Contracts: Crude-linked long-term SPAs (Brent slope indexation), Henry Hub-linked US LNG export contracts, and Spot RLNG cargos priced against the Platts JKM benchmark.
- Physical Gas Exchange: Domestic spot trading on the Indian Gas Exchange (IGX) referenced against regional delivery hubs (Dahej, Hazira, Dabhol, KG Basin) and the GIXI index.
3. Pillar 1: Domestic Gas (APM, HPHT & New Well)
Domestic gas pricing in India has undergone a major regulatory overhaul following the adoption of the Kirit Parikh Committee recommendations in April 2023. Today, domestic output is divided into three distinct mechanisms:
- 1. APM Gas (Nominated Fields): Administered Price Mechanism gas produced by ONGC and OIL is linked to 10% of the monthly Indian Crude Basket price, subject to a floor of $4.00/MMBtu and ceiling of $6.50/MMBtu (escalating $0.25/year).
- 2. HPHT Deepwater Gas (Ceiling Cap): Produced from deepwater blocks (such as KG-D6 and KG-98/2), auctioned freely subject to bi-annual sovereign ceiling caps.
- 3. New Well Gas Premium: Gas produced from newly drilled wells in nominated blocks receives a 20% premium over the APM rate.
Historical APM Domestic Gas Price (2017 – 2026)
From the pandemic low of $1.79/MMBtu to the post-crisis peak of $8.57/MMBtu and stabilization under the Parikh formula
4. Pillar 2: Imported LNG (Spot, Crude & Henry Hub)
Because domestic production satisfies less than half of national demand, the remaining 51.5% is met through imported Liquefied Natural Gas (LNG). Industrial users must secure supplies across three distinct contract structures:
- Spot RLNG (Platts WIM / DES West India): Uncommitted, cargo-by-cargo purchases. Highly volatile and hyper-sensitive to global geopolitical disruptions (such as the 2022 European gas crisis and the 2026 Strait of Hormuz conflict). Ex-terminal spot prices have swung from sub-$5.00/MMBtu in 2020 to over $35.00/MMBtu in 2022 and $18.18/MMBtu in 2026 YTD.
- Crude-Linked Long-Term Contracts: The foundation of India's long-term LNG portfolio (e.g. Petronet LNG's contracts with QatarEnergy). These contracts index the gas price to a slope percentage of Dated Brent crude (typically 12.0% to 13.5% of Brent plus a fixed constant). This protects buyers against wild spot spikes while providing long-term volume certainty.
- Henry Hub-Linked Contracts (US LNG): Born out of the US shale revolution (e.g. GAIL's contracts from Sabine Pass and Cove Point). The landed price is formulated as:
P = 1.15 × Henry Hub + Liquefaction Fee ($3.00–$3.50) + Shipping ($1.50–$2.50) + Regasification. This indexes supply directly to North American gas fundamentals rather than global petroleum markets.
Comparative Landed Gas Prices at Dahej (Aug 2024 – Aug 2026)
Monthly ex-terminal landed prices ($/MMBtu) comparing domestic APM, HPHT ceiling, Spot RLNG, and Term contracts
5. Pillar 3: The Exchange Frontier (GIXI / IGX)
The seventh regime bridging the domestic and imported sectors is the Gas Index of India (GIXI), traded on the Indian Gas Exchange (IGX).
Authorized by the Petroleum and Natural Gas Regulatory Board (PNGRB), IGX operates an electronic trading platform delivering Day-Ahead, Daily, Weekly, Fortnightly, and Monthly contracts at physical delivery hubs including Dahej, Hazira, Dabhol, and the KG Basin.
While physical volumes transacted on the exchange currently represent a small fraction of total national consumption due to legacy long-term bilateral tie-ups, GIXI is rapidly emerging as India's benchmark for true market-clearing domestic spot prices. As pipeline open access and the unified pipeline tariff regime mature, exchange liquidity is poised to play an increasingly central role in market price discovery.
6. 10-Year Price Dynamics & Spot vs Term Divergence
Analyzing the historical trajectory of imported LNG contracts from CY 2020 through 2026 YTD illuminates why contract diversification is vital for industrial viability:
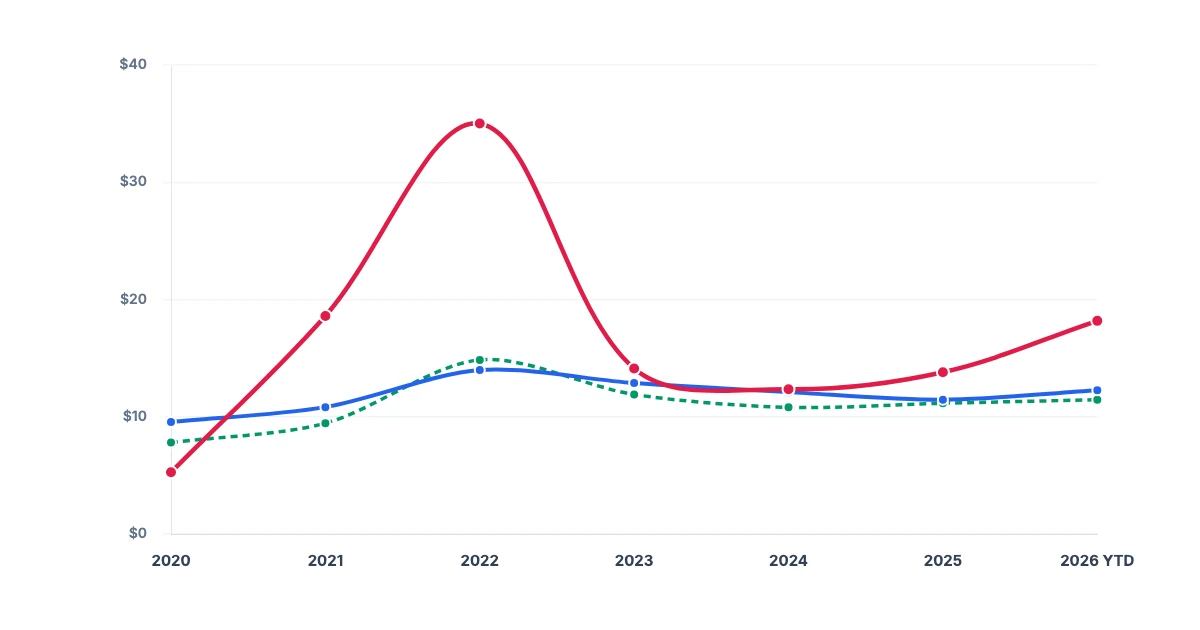
Spot vs Long-Term LNG Landed Annual Averages (CY 2020 – 2026 YTD)
Calendar year average landed prices ($/MMBtu) highlighting the extreme volatility of spot cargoes vs stable term indexation
The data clearly demonstrates the cyclical vulnerability of spot-only procurement:
- 2020 Spot Low ($5.26/MMBtu): During the pandemic slump, uncommitted buyers enjoyed historically cheap spot gas, creating a false perception that long-term contracts were uncompetitive.
- 2022 Shock ($35.01/MMBtu): When the Russia-Ukraine war erupted, spot prices exploded by nearly 600%, causing widespread plant shutdowns across non-priority Indian industries. Meanwhile, Crude-linked ($13.98) and Henry Hub-linked ($14.85) term contracts cushioned contracted buyers.
- 2026 YTD Disruption ($18.18/MMBtu): The Strait of Hormuz disruption drove a fresh 40% premium in spot prices, while long-term contracts remained stable between $11.45 and $12.26/MMBtu.
7. 5-Year Risk Matrix & Portfolio Blending
To quantify the financial risk associated with different gas procurement strategies, we evaluated historical monthly pricing data across a 5-year horizon using two critical statistical metrics:
- 5-Year Average Landed Price ($/MMBtu): The base-case long-term cost of delivered energy.
- Volatility / Risk Coefficient of Variation (CV = σ / μ): The degree of price unpredictability and budget risk.
- Peak Price Exposure (Max Price): The extreme worst-case cash flow stress during global supply disruptions.
5-Year Risk & Volatility Profile of Gas Procurement Strategies
X-axis: 5-Year Average Price ($/MMBtu) | Y-axis: Volatility (CV) | Bubble Size: Maximum Peak Exposure ($/MMBtu)
The findings from the portfolio risk matrix provide crucial takeaways for corporate energy procurement teams:
- 100% Spot Exposure is High Risk: While offering operational flexibility, pure spot purchasing yields the highest average cost ($19.78/MMBtu), the highest volatility (CV 0.52), and catastrophic peak exposure ($56.30/MMBtu).
- Crude & Henry Hub Provide Stability: Pure Crude-linked (Avg $11.98, CV 0.143, Max $16.05) and pure Henry Hub (Avg $11.59, CV 0.195, Max $18.08) offer superior price predictability.
- Optimal Blended Portfolio: A diversified blend of 50% Crude-Linked + 30% Henry Hub-Linked + 20% Spot delivers an attractive landed cost of $13.42/MMBtu while slashing volatility down to 0.237 and capping peak price risk at $24.47/MMBtu.