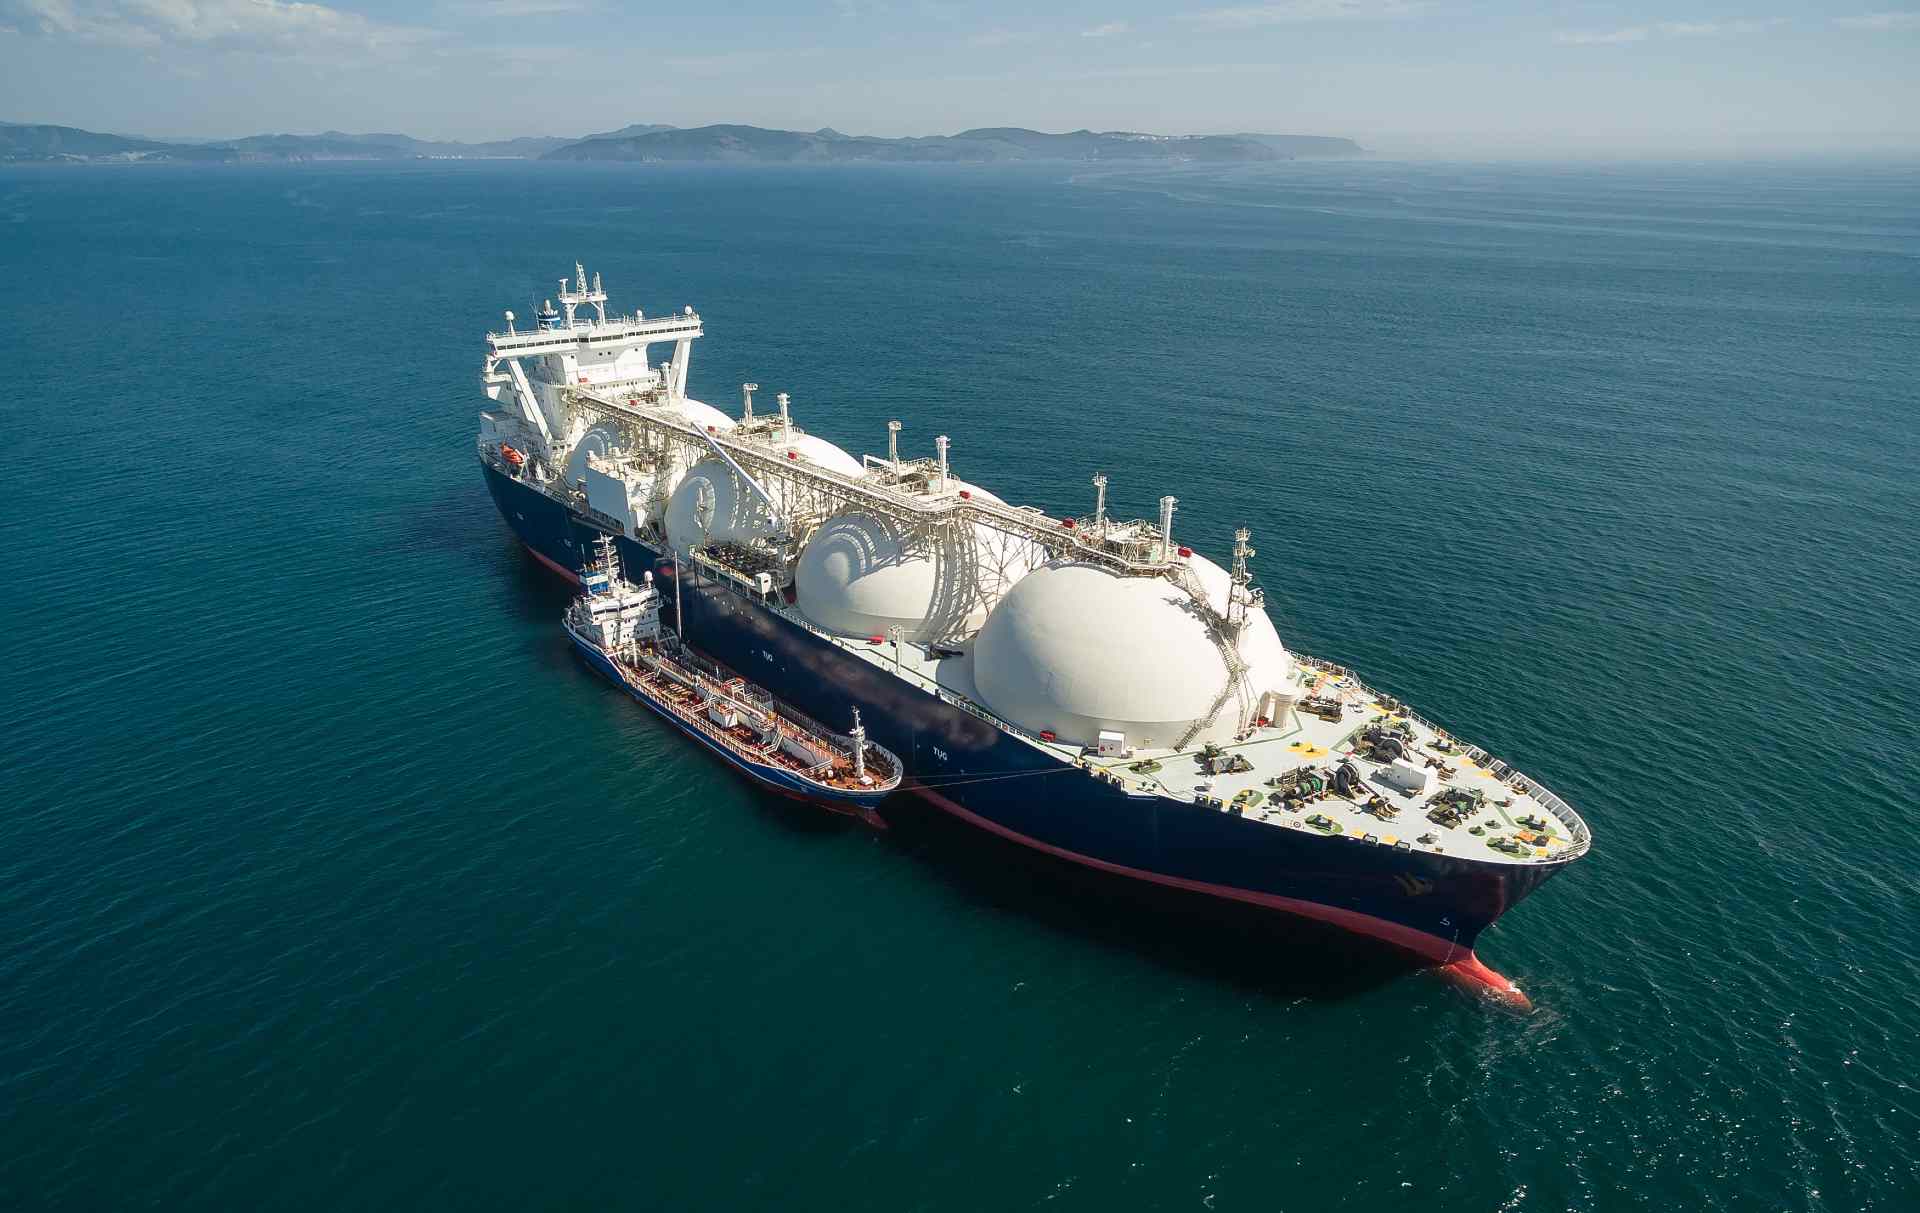

After a difficult first quarter when LNG supply disruptions triggered emergency rationing and forced several industries to cut consumption, India's natural gas demand bounced back in Q2 FY27. Total consumption rose 5.9% QoQ to 13.47 MMT (193 MMSCMD), restoring volumes to pre-crisis levels. But the recovery came with a critical catch: with domestic gas output virtually flat, imported RLNG met a record 54.25% of national demand.
The Post-Crisis Turnaround: How Gas Demand Bounced Back
The first quarter of FY27 was defined by severe supply distress. Disruptions in the Strait of Hormuz in March 2026 stranded term LNG shipments and triggered steep price spikes, forcing the Ministry of Petroleum & Natural Gas (MoPNG) to implement emergency gas supply allocations. Non-priority sectors bore the brunt: petrochemical crackers were throttled, gas-based power generation collapsed, and industrial consumers faced acute quota curtailments.
However, demand began recovering even before the government formally withdrew the emergency supply regulation orders on July 4, 2026. Indian importers responded proactively to term cargo delays by securing alternative spot LNG shipments from other global export hubs—particularly Oman and the US Gulf Coast.
As these flexible volumes landed at Dahej, Hazira, and Dabhol terminals, industrial consumers and city gas networks regained feedstock access just as fertilizer units scaled up production for the monsoon planting season.
Macro Consumption: Restoring Pre-Crisis Run-Rates (13.47 MMT)
During Q2 FY27 (July–September 2026), national natural gas consumption climbed from 12.72 MMT in Q1 to 13.47 MMT, representing a 5.9% sequential increase (+0.75 MMT).
This gain completely erased the Q1 contraction and restored India's natural gas run-rate to 192.6 MMSCMD, exactly matching year-ago levels (13.45 MMT in Q2 FY26).
Quarterly Natural Gas Consumption Trajectory (Q4 FY25 to Q2 FY27)
Total national gas consumption in Million Metric Tonnes (MMT)
What Changed in Q2? Sector-Wise Waterfall Breakdown
The 0.75 MMT sequential expansion in Q2 FY27 was driven primarily by fertilizer replenishment and the restart of throttled petrochemical capacity:
- Fertilizer (+0.35 MMT; +9.8% QoQ, +0.5% YoY) — Urea manufacturing anchored demand, ramping up to support the monsoon kharif sowing season with priority feedstock allocations.
- Petrochemicals (+0.23 MMT; +54.8% QoQ, -12.2% YoY) — After taking the hardest hit during Q1 rationing when major steam crackers were throttled by almost 50%, petrochemical intake surged by 56% sequentially once feedstock quotas were restored (though volumes remain 12% below normal pre-crisis baselines).
- Power (+0.14 MMT; +9.7% QoQ, -1.2% YoY) — Gas-fired generation rebounded as a deficit late-monsoon curtailed hydroelectric generation. In late September, all-India peak power demand surged to 269 GW—just 1 GW below the all-time historic record—forcing grid operators to dispatch gas peaking plants during evening deficit hours.
- City Gas Distribution (CGD) (+0.05 MMT; +1.3% QoQ, +21.3% YoY) — Sustained rapid structural momentum, rising 21.3% year-on-year to 3.82 MMT in the quarter, backed by network expansion and CNG fleet additions.
- Refineries (-0.05 MMT; -6.0% QoQ, -21.8% YoY) — The only major contracting sector. Favorable crack spreads led refiners to optimize economics by substituting spot LNG with internally generated refinery off-gas, fuel oil, and low-cost naphtha for hydrogen generation and captive steam.
- Others / Industrial (+0.03 MMT; +1.1% QoQ, -11.2% YoY) — Small-scale glass, ceramics, and metal manufacturing in western and northern clusters saw modest sequential recovery.
Sectoral Sequential Gas Consumption Waterfall (Q1 FY27 to Q2 FY27)
Net changes by sector driving the +0.75 MMT sequential demand recovery (Million Metric Tonnes)
| Consuming Sector | Q2 FY27 Volume (MMT) |
Sequential Change (QoQ vs Q1) |
Annual Change (YoY vs Q2 FY26) |
|---|---|---|---|
| Fertilizer | 3.92 MMT | +0.35 MMT (+9.8%) | +0.02 MMT (+0.5%) |
| Petrochemicals | 0.65 MMT | +0.23 MMT (+54.8%) | -0.09 MMT (-12.2%) |
| Power Generation | 1.58 MMT | +0.14 MMT (+9.7%) | -0.02 MMT (-1.2%) |
| City Gas Distribution (CGD) | 3.82 MMT | +0.05 MMT (+1.3%) | +0.67 MMT (+21.3%) |
| Refineries | 0.78 MMT | -0.05 MMT (-6.0%) | -0.22 MMT (-21.8%) |
| Others / Industrial | 2.72 MMT | +0.03 MMT (+1.1%) | -0.34 MMT (-11.2%) |
| Total Natural Gas Consumption | 13.47 MMT | +0.75 MMT (+5.9%) | +0.02 MMT (+0.1%) |
The Larger Picture: CGD Overtakes Fertilizer Across H1
Looking beyond the single-quarter rebound, a significant structural milestone occurred across the first half of the fiscal year:
Across H1 FY27 (April–September 2026), City Gas Distribution consumption reached 7.59 MMT, overtaking fertilizer at 7.51 MMT to become India's largest natural gas-consuming sector.
This historic shift is driven by deep structural drivers:
- India's operational retail network has expanded to surpass 9,000 CNG stations across more than 300 Geographical Areas (GAs).
- Factory-fitted CNG models now represent 1 in every 4 new passenger cars sold nationwide (24.3% market share), creating an expanding, non-discretionary retail fuel demand base.
- Domestic PNG kitchen connections continue expanding under PNGRB Minimum Work Programme commitments.
The Catch: Supply-Side Realities & Record 54.25% Import Share
While India successfully restored its gas consumption volumes, the supply-side picture raises a critical strategic concern:
- Domestic gas production increased by just 0.15 MMT QoQ (+2.5%) to 6.16 MMT.
- Imported RLNG increased by 0.60 MMT QoQ (+8.9%) to 7.31 MMT (9,612.47 MMSCM).
Because domestic field additions could not keep pace with recovering demand, imported RLNG accounted for a record 54.25% of India's total natural gas consumption in Q2 FY27.
Q2 FY27 Supply-Side Gas Balance: Domestic vs Imported RLNG
Breakdown of 13.47 MMT total national consumption
Looking specifically at imported gas volumes:
- Second-highest quarterly level on record: Total RLNG consumption of 9,612.47 MMSCM is the second-highest quarterly volume in Indian natural gas history, trailing only the extreme summer power-crisis peak of Q1 FY25 (9,800.64 MMSCM).
- Highest Q2 ever: For a July–September monsoon quarter, Q2 FY27 represents the highest imported RLNG volume ever recorded (+3.28% YoY over Q2 FY26).
India has successfully restored its gas consumption volumes, but the recovery has come with greater dependence on imported LNG. With global maritime corridors remaining vulnerable, this growing exposure underscores the strategic need for long-term supply diversification and upstream domestic development.